Long-term inflation trends: If you’re projecting 20, 30, even 40+ years of a client’s future, it’s sensible to look at what inflation has been doing over a similar period. I’ve chosen to use the Retail Price Index (RPI) and as a yardstick, the 30-year average of the RPI is 2.840%.
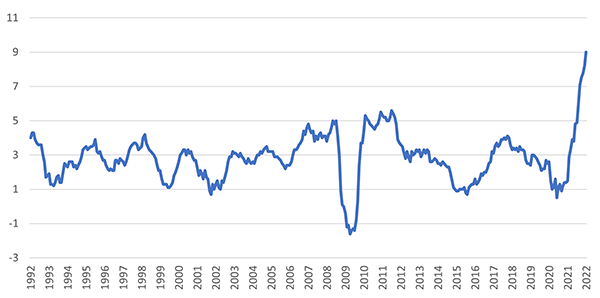
Here’s what it’s been up to since 1992 (data from the Office for National Statistics (ONS)):
RPI for the past 30 years

As you can see – it's been a pretty volatile 30 years. RPI has been as low as -1.6 and (of course) as high as 9% (March 2022). But the thing about long-term trends is that they change slowly, a bit like a freight ship turning around.
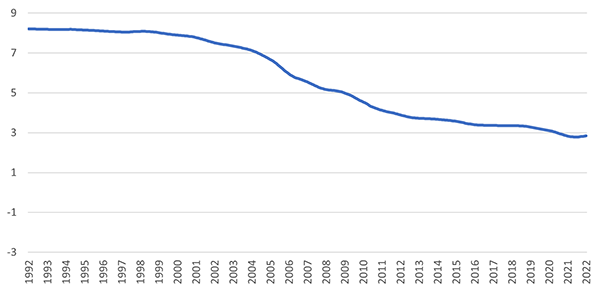
Here’s what the rolling 30-year average of the RPI looks like, over the same period

You can see the little tiny uptick at the end as the long-term average is trending back towards 3%.
Short-term vs. long-term
So, what’s going to happen in the next couple of years and how will/should that impact what we do with clients’ cashflow models?
The Office for Budget Responsibility (OBR) forecasts that CPI will peak at 8.7% in the final quarter of 2022. If RPI continues to trend a couple of per cent above CPI, this could mean RPI rates of nearly 11%.
BUT (and it’s a big ‘but’) the OBR expects inflation to return to the Monetary Policy Committee’s target of around 2% by 2024. The ONS predicts that standards of living in the UK will take their biggest hit since 1956. However, this isn't due to a long-term trend, it's due to a short-term shock.
What we're experiencing at the moment is a large disparity between earnings indexation and inflation. Would it be sensible to assume a long-term inflation rate of 8.7%, purely because that's where inflation is predicted to peak? Would it be sensible to assume your client's earnings will only grow at 0.5% per annum for the next 15 years, because that's the pay rise they received this year?
By all means, show clients the impact of higher inflation, but that doesn’t mean this should form the basis of your advice.
I’d recommend showing clients the potential impact of a long-term shift in inflation rates as a hypothetical: “Here's a scenario where inflation is 3.5% or 4%, rather than 3%, and how it might impact your standard of living”.

But, I don't think it's reasonable now, to make long-term changes based on what is ultimately a very short-term trend.
So, how long should we wait?
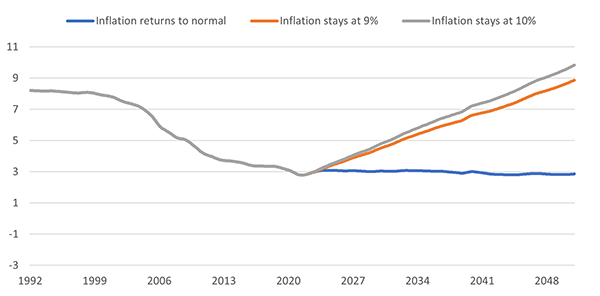
Consider a scenario where inflation stays at the current level of 8.2% forever and another where it increases to 10% and stays there. How long do you think it will take before we see an impact on that 2.840% figure?
Projected rolling average

For my baseline, ‘inflation returns to normal’, I’ve followed the government’s projections. I’ve assumed RPI continues to grow at .5% a month until it reaches 10.7% (2% above CPI projections), then falls by .5% a month until it returns to the MPC’s long-term target of 2.5%.
If inflation were to stay at the current level of 9% and stay there, it would take:
- 12 months to reach a rolling 30-year average of 3% (early 2023)
- 68 months to reach a rolling 30-year average of 4% (mid 2027)
- 123 months to reach a rolling 30-year average of 5% (mid 2032)
If inflation were to increase to 10% and stay there, it would take:
- 11 months to reach a rolling 30-year average of 3% (early 2023)
- 59 months to reach a rolling 30-year average of 4% (early 2027)
- 109 months to reach a rolling 30-year average of 5% (early 2031)
Here’s the same information in a table:
|
|
Months to 3%
|
Months to 4%
|
Months to 5%
|
Months to 6%
|
Months to 7%
|
Months to 8%
|
|
Inflation stays @ 9
|
12
|
68
|
123
|
182
|
247
|
300
|
|
Inflation stays @ 10
|
11
|
59
|
109
|
156
|
209
|
264
|
So what?
- inflation is unlikely to remain at 9%+ for the long term.
- I’ve heard (and seen) examples of advisers using 8% inflation figures in cashflow models. But the data above shows that we would need current levels of inflation to persist for nearly 30 years before the long-term average for inflation gets over 9%.
Bearing in mind just how detrimental a force long-term inflation can be on a client’s cashflow, showing them the impact of their cost-of-living compounding at 9% per annum while their investments grow at, for example, 5% for 40 years (-3% real return!) will almost certainly paint a highly pessimistic picture of their financial futures.
So now, when a client calls worried about the latest headlines on financial markets you tell them to hold tight and explain the long-term vision. Why should inflation be any different?
That said, we do need to keep a close eye on things. If inflation creeps even higher, there’s a very real chance that by next year your 3% inflation assumption could be a little on the low side. If things stay that way for … about another six years, then maybe it would be prudent to increase your inflation assumption. But only by 1%, not 5%!
In short: please don’t adjust your cashflow models to use an inflation rate of 9%. At least, not yet.
Caveat
This article is my opinion, based on mathematical projections of average inflation rates without any consideration of the macroeconomic and socioeconomic factors at play.
It is intended to help advisers justify their modelling assumptions, when challenged by clients, and to make sensible long-term assumptions in an unprecedented time. A long-term rolling average is not the only fair measure or justification for inflation assumptions in a long-term cashflow projection. You can, of course, use whatever assumptions you like, providing you justify them to your clients.