As the CISI turns 30, we look through a UK lens at the performance of significant investment types, as well as the trends of financial markets
by Andy Davis
The CISI’s 30th anniversary is an ideal moment to pause and look back over the three decades since the Institute was founded. What stories and patterns emerge from this 30-year span of financial markets data?
There has been no shortage of drama in financial markets: the Asian Financial Crisis of 1997, the dot-com bubble of 2000, the global financial crisis of 2007–8, the eurozone crisis of 2011, Covid-19 since 2020, and now the world’s emergence into an inflationary and heavily disrupted post-pandemic economy. Episodes like these stand out because of their impact, but also because they unfold over months or a year or two, at a pace that suits our news cycles and attention spans. But they have all taken place against a backdrop of longer-term, more slow-moving trends – some of which we barely notice in our everyday lives because their progress is so gradual.
Gradual, certainly, but nonetheless relentless. So, 30 years is long enough to see them in action and understand the impact they have had, little by little.
By chance, the CISI’s first 30 years overlap pretty neatly with the opening decades of the online era. To take one example, Jeff Bezos founded Amazon in July 1994 and the company went public in May 1997, at a price (adjusted for stock splits) of US$0.075 a share. Some 25 years later, Amazon trades around US$113 a share, even after recent falls. No one needs reminding that internet adoption has had a gigantic effect on financial markets over the past 30 years. What they might not be so aware of, however, is quite how dramatically this has reshaped the composition of the indices the world watches most closely.
Investment returns earned in US dollars receive a boost by being translated back into a depreciating currency According to Morningstar data, the technology sector’s weighting in the S&P 500 index of the largest US companies hit a low of 6.3% at the end of 1992. In April 2022, tech’s weighting was around 28%, according to Bloomberg. Viewed through this lens, the past 30 years represent the digital equivalent of the industrial revolution.
Technology, however, is a story dominated by US entrepreneurs. What is the view like from the UK? UK investors in the S&P 500 must naturally count their gains and losses in sterling unless they are hedged. Calculating the S&P’s performance over the past 30 years from a UK perspective highlights another powerful long-term trend: the depreciation of the pound.
In US dollar terms, the S&P 500 has returned roughly 8.3% a year since 1992.* Calculated in sterling, it is more like 9.4% – investment returns earned in US dollars receive a boost by being translated back into a depreciating currency. The gap of just over 1.1 percentage points is huge. It represents approximately 13% of extra nominal returns per year for a sterling investor, simply as a result of currency effects.
This illustrates the wisdom of those UK investors who overcame home bias and placed a decent portion of their capital in non-UK assets, particularly large-cap US shares. The powerful performance of the US market gained a significant tailwind from the currency effect.
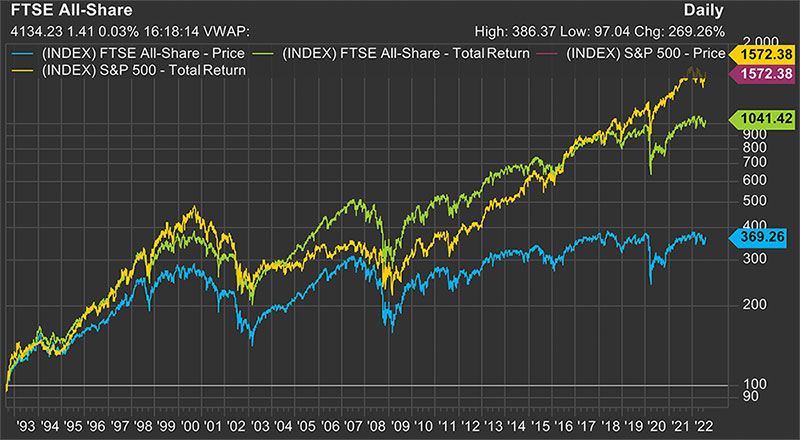
For those investing in UK equities, however, data for the past 30 years also illustrates the massive importance of reinvested dividend income to overall returns. Over the 30 years from February 1992, the FTSE All-Share returned 4.45% a year in price terms. With dividends reinvested, however, its total return was 8.12% a year.

Source: FactSet financial data and analytics
What explains this divergence? Partly it is the presence of large, international companies on the UK stock market that earn a lot of their revenue in other currencies, particularly US dollars, but pay dividends that are translated into sterling. The currency effect has helped to amplify the contribution of dividends to the index’s total return for sterling investors. This combination of international earnings and a depreciating domestic currency might, in turn, help explain why equity income became such a popular investment style in the UK.
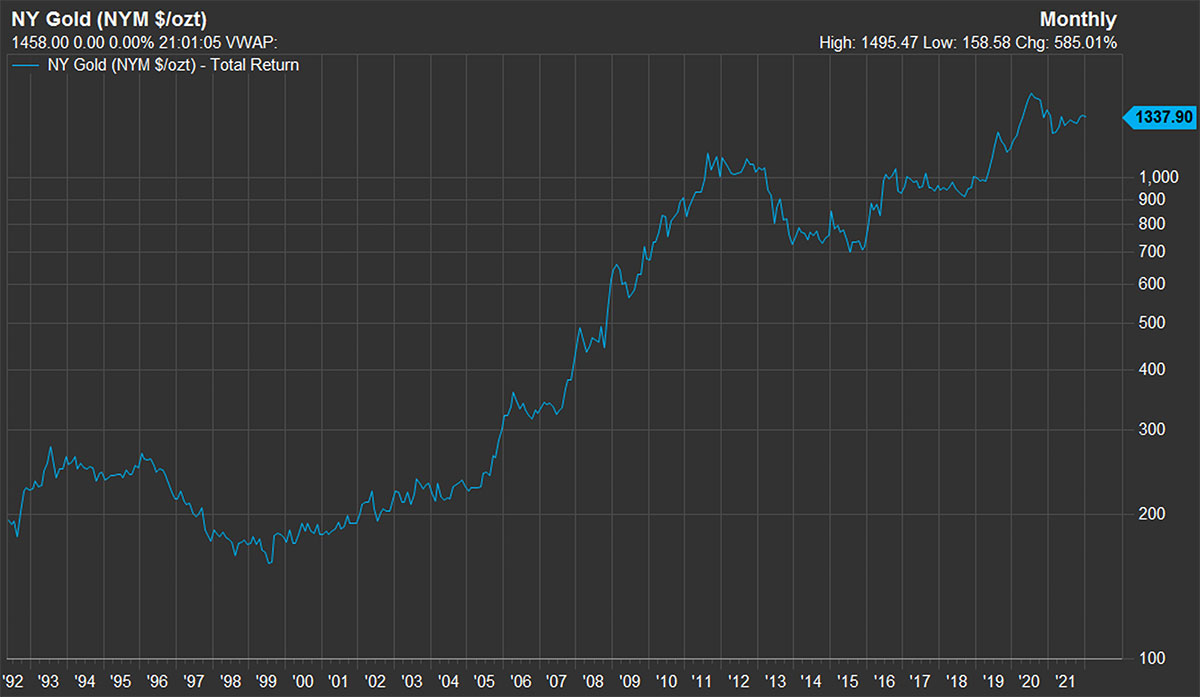
Investing in gold is a popular way to guard against depreciation of paper money. Sterling investors have gained about 9% a year since 1992 on their gold holdings – only a whisker less than their return from the S&P 500.

Source: FactSet financial data and analytics
There have been many dramatic turns in financial markets over the past 30 years and it looks as if the latest is upon us with the return of inflation and higher interest rates after a 40-year down-cycle. But beneath and between these events, large multi-decade trends – such as the build-up of debt on global balance sheets thanks to falling interest rates – have done at least as much to determine our investment returns. Events such as the CISI’s 30th anniversary provide a welcome prompt to stand back and let them come into focus.
*All return calculations are based on data from Sharepad. Many thanks to Amy Lazenby, Chartered FCSI, managing director at Close Brothers, for providing the FTSE All-Share and gold charts from source: FactSet financial data and analytics.
The full article was originally published in the September 2022 edition of The Review.
The flipbook edition is now available online for all members.
All CISI members, excluding student members, are eligible to receive a hard copy of the quarterly print edition of the magazine. Members can opt in to receive the print edition by logging in to MyCISI, clicking on My account, then clicking the Communications tab and selecting ‘Yes’.
Once you have read the print edition, keep coming back to the digital edition of The Review, which is updated regularly with news, features and comment about the Institute and the financial services sector.